Do you know which sites send you the most amount of traffic? What’s the most engaging content on your site? Which pages have the highest bounce rate? And how many of your subscribers are actually clicking through and buying from your newsletter?
A good analytics package such as Google Analytics allows you to find out the answers to these questions and so much more. With this data, you can improve your site in order to attract even more visitors and turn them into loyal customers.
But understanding how to use an analytics package can be difficult. So here’s how to acquire that data and use it to improve your site – from creating goals and reports to tracking marketing campaigns and optimising your site based on visitor technology.
Creating goals in Google Analytics
We’ll be using Google Analytics as our example, as it’s free to use and filled with features. If you aren’t using it yet, now’s the time to start.
If you want to track what your visitors do on your site, whether it’s the amount of time they spend on your site, the number of pages they visit, the forms they complete, or the purchases they make, the easiest way is to create goals. Whenever a user completes a certain action that you’ve set as a goal, Google Analytics logs it as a conversion.
These goals will give you more information on your highest converting traffic sources, the organic search keywords that send you the most customers, the conversion rates of your pages, and more.
If you don’t know what goals to set up, start by thinking about your objectives. If you have an online shop, you might want to track sales. If you want to attract more subscribers to your mailing list, track the number of newsletter sign-ups. Or if you’re offering a free resource, such as an e-book, infographic, or white paper, you can track the number of downloads.

How to set up a goal
Go to Admin -> View -> Goals.
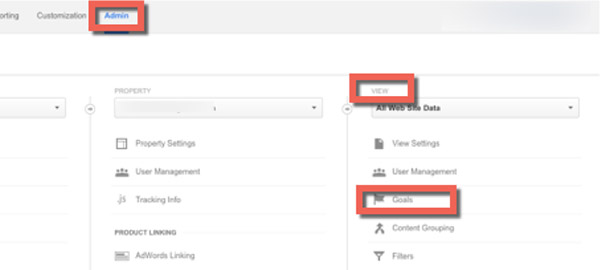
There are a variety of pre-configured goals available, such as completed purchases, newsletter sign-ups, connections via chat, or you can create your own custom one to meet your needs.
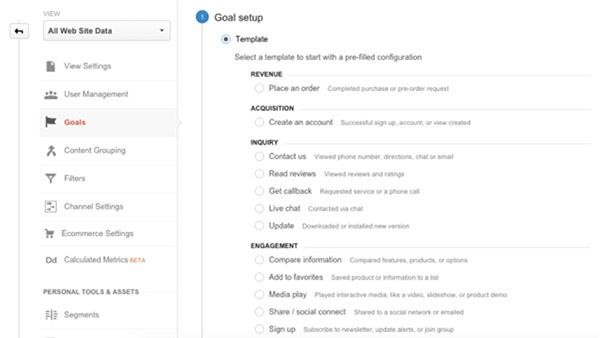
After you’ve chosen your goal, give it a name and then choose your goal type – where your customers go next, how long they spend on your site, the number of pages they visit, or a particular event you want logged.
After you’ve specified the criteria for each goal, click “Save” to create your new goal.

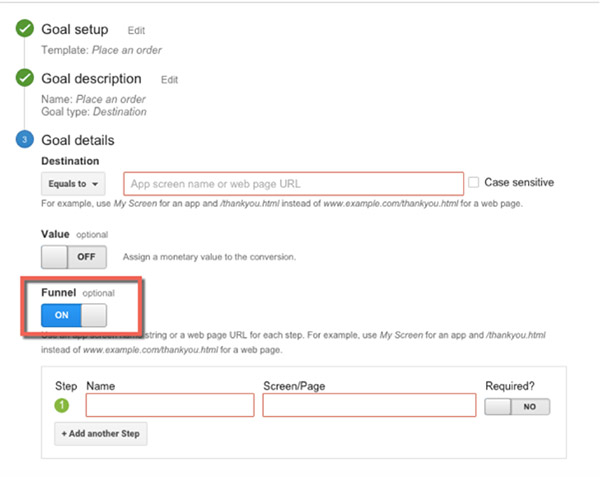
Setting up funnels
Funnels show you how many of your visitors travel towards your goals, and at what stage they choose to leave the process. For example, by setting up a funnel for your payment confirmation page, you can see where visitors stop before they finalise that order.
These funnels provide greater insights than just having goals by themselves. Goals serve more as key performance indicators, but funnels allow you to isolate the problems that might occur at any point in the visitors’ conversion paths, showing you exactly where you can optimise effectively.
To set up a funnel, you need to click “On” for Funnel before you save your goal. Add the name and the page for the funnel and then save the goal.
After you’ve set up both your goal and your funnel, give your site some time to collect data. And once it has that data, the Funnel Visualisation report will give you that important bit of information – the Funnel Conversion Rate. How many of your visitors are reaching your goal and where they’re falling by the wayside.
![]()
Setting up and using event tracking
Event tracking is a feature that allows you to track customer actions whether or not a URL change is recorded. This can include clicking on links, email addresses, social media icons, or file downloads.
By adding event tracking to your links and downloads, you can have greater insight into how people interact with your website. There are four types of information used in event tracking: Category, Action, Label, and Interaction.
Event tracking uses the following code structure added to links:
_gaq.push(['_trackEvent’, 'category’, ‘action’, ‘label’, Value, interaction)
So, for example, if you wanted to track how many times a white paper has been downloaded, you would use the following code:
<a href="/white-papers/white-paper.pdf" onClick="_gaq.push(['_trackEvent', 'white paper', 'Download', Research into X']);">Download our white paper now</a>
You can use event tracking to trace a range of things, such as:
- Which call to action buttons are used the most on your page?
- How many times are your white papers being downloaded?
- Which advertisements are getting the most clicks on your website?
Gravitate Design has written an excellent guide on how to set up event tracking for Google Analytics.

Tracking online marketing campaigns
With Google Analytics, you can add tracking IDs to links, making it ideal for reporting on your Return on Advertising Spend (ROAS). Whether using them for PPC, banners, email, or social media, you can identify:
- utm_source: The source of the traffic (e.g. social media, newsletter)
- utm_medium: The marketing medium (e.g. email, display)
- utm_campaign: Your campaign’s name
- utm_content: The content within the campaign (if you have multiple links in one campaign)
You can add these IDs to every link you want to track, and to save time, you can use Google’s URL builder.
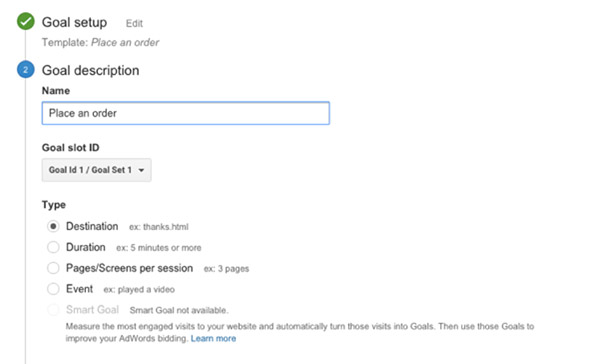
For example, we might want to create a custom link to track the number of clicks from an email newsletter that sends people to our blog. We add all the information into the URL builder:
![]()
And when we click “Generate URL”, you will see the following:
https://www.heartinternet.uk/blog?utm_source=february_newsletter&utm_medium=email&utm_content=blog&utm_campaign=blog
When you want to analyse this data, go to Acquisition -> Campaigns in Google Analytics. But make certain that you analyse more than just the number of clicks. Effective online marketing should be judged on what a visitor does on your website, not that they just arrived.
And once you have all the data you want to analyse, it’s time to build your reports.
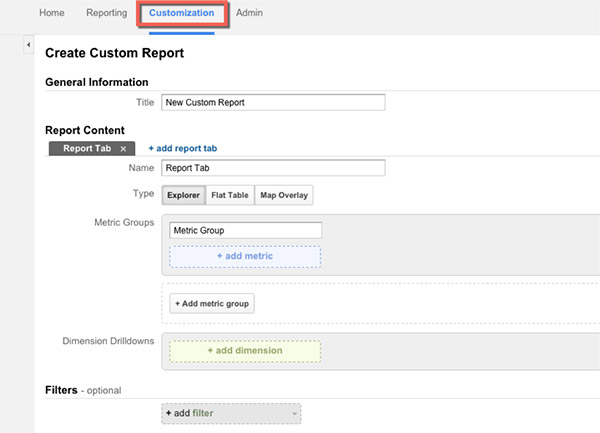
Building your reports
Google Analytics provides ready-made reports with most of what you need, or you can create your own custom reports to get information tailored to your specific needs.
With a custom report, you can pick the dimensions (e.g. browser, traffic source, event action, etc.), metrics (e.g. revenue, visits, page views, bounce rate, etc.), and how that data should be displayed.
To create a new report, go to the “Customisation” tab at the top of any page, and click “+New Custom Report” from the top of the table.
Give it a name, and then choose what data you want your report to include. Here are some examples of how you can combine dimensions and metrics to create reports with the answers you want:
What’s your most engaging and valuable content?
- Page Title (Primary Dimension)
- Entrances
- Unique Visitors
- Bounces
- Page Views
- Average Time on Page
- Per Visit Goal Value
- Goal Completions
What websites are sending you the best traffic?
- Source (Primary Dimension)
- Landing Page
- Visits
- Goal Completions
- Page per Visit
- Bounce Rate
- Percentage of New Visits
How is your social media performing?
- Landing Page (Primary Dimension)
- Source (Secondary Dimension)
- Visits
- Social Actions
- Goal Completions
- Goal Conversion Rate
- Goal Value
Where are your best converting visitors coming from?
- Source or Medium (Primary Dimension)
- Visits
- Percentage of New Visits
- Bounce rate
- Pages per Visit
- Revenue
- Average Value
- Value per Visit
If you want to save some time creating your reports, Google have provided, along with their default reports, a series of ready-to-install custom reports at their Google Analytics Solutions Gallery.

Identifying trends
Are your customers more likely to buy during business hours or at weekends? Are there certain hours, days, weeks, or months where there’s a spike in traffic? How many of your visitors are using smartphones to browse your site, and are the numbers growing?
Identifying trends allow you to figure out when it’s the best time to publish new content or release a new product, and when to promote it to ensure it reaches your target audience.
Reports under Acquisition -> Channels will show you which days, weeks, and months drive the most traffic to your website. By combining this information with your goals and your e-commerce data, you’ll be able to determine when most of your audience convert.

Optimising based on visitor technology
With smartphones becoming the UK’s most popular device for getting online, you can’t afford to not optimise your site for mobile. But with so many devices and technologies out there, how do you know which ones will be critical to your business?
Go to Audience -> Technology and Audience -> Mobile to get a clear picture of the technologies and devices your customers use when visiting your site.
In Google Analytics, you’ll find:
- Browser (and which version)
- Operating system
- Screen resolution
- JavaScript enabled
- Device type
- Device model
You can add this data into your custom reports for identifying common technology trends or bottlenecks where your website might not be displaying correctly.
High bounce rates, lower than average conversion rates, and very short visitor duration periods are red flags, especially on mobile devices.
We hope this guide has helped you tailor your data collection and reporting to your needs. What data are you using to get more insights into your visitors’ behaviour?
Icons from Linearicons by Perxis.
Comments
Please remember that all comments are moderated and any links you paste in your comment will remain as plain text. If your comment looks like spam it will be deleted. We're looking forward to answering your questions and hearing your comments and opinions!