
When it comes to debugging the front-end, if you’re like many developers, you basically live in your browser’s developer tools. But even after having worked in Chrome’s developer tools for quite a few years, I still come across tips, tricks, and features that I haven’t seen before.
In this article, I’ve compiled a number of CSS-related features and tricks available via developer tools that I think will take your CSS development to a new level. Some of these tips aren’t specifically only for CSS, but I’ll present them in a CSS context.
Some are simple tips for workflow and debugging, while others are new features that have rolled out in recent years. Most are based on Chrome’s DevTools, but I’ve also included a few Firefox tips.
Examine CSS for an element that appears via JavaScript
Finding the CSS for most elements in the DevTools Elements panel isn’t difficult. In most cases you can just right-click the element, inspect it, then (if necessary) drill down to find it in the Elements panel. Once it’s selected, the CSS will appear in the Styles panel, ready to edit.
Sometimes an element appears dynamically as a result of some JavaScript-based user action like click or mouseover. The most obvious way to make the element appear is to temporarily alter your JavaScript and/or CSS to make the element visible by default, so you can deal with it without needing to mimic the user action.
But if you’re looking for a quick way to make the element visible using just your DevTools, here are the steps to do this:
- Open DevTools
- Open the Sources panel
- Carry out the user action to make the element visible (e.g. mouseover)
- Hit F8 (same as “Pause script execution” button) while the element is visible
- Click the “Select an element…” button in DevTools
- Click the element on the page
We can test this using Bootstrap’s tooltips, which only appear when hovering over a link, triggered via JavaScript. Here’s a demonstration:
As you can see at the start of the video, I can’t initially reach the element to inspect it, because it disappears on mouseout. But if I stop script execution while it’s visible, it will stay visible so I can inspect it properly. Of course, if it was simply a CSS :hover effect, then I could make it appear using the “Toggle element state” section of the Styles panel. But in this case, this is probably the best way to grab the styles of an element whose visibility is triggered via JavaScript.
Search for an element using CSS selectors
You might know that if you want to search for an element in the Elements panel, you can do this using a find feature (CTRL-F/CMD-F) that’s built in. But notice when you view the “find” field, it gives you the following instructions:
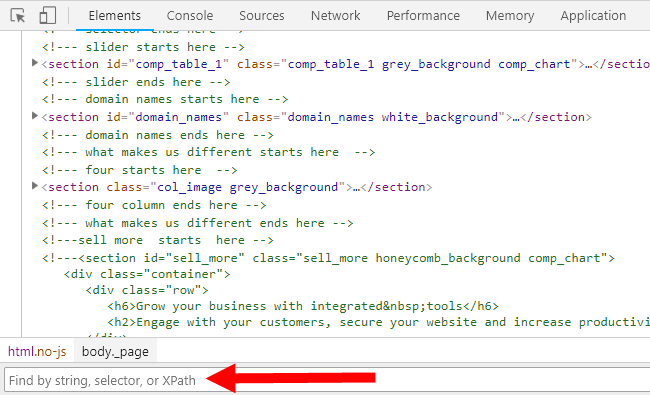
As I’ve indicated in the screenshot, you can find an element “by string, selector, or XPath”. I’ve used “string” many times before but only recently realised I can use a selector for this.
You don’t have to use a selector that’s in use in the CSS, it could be any valid CSS selector. The find feature will tell you if your selector matches any elements. This could be useful for finding elements but might also help for testing selectors to see what works.
Below is a demo that uses the selector body>div to search and cycle through all the div elements on the page that are direct children of the body element:
As mentioned, this search can be done with any valid selector, which would be similar to using JavaScript’s querySelector() or querySelectorAll() methods.
Edit the box model directly
The box model is one of the first things you learn when you start out with CSS. As this is an important aspect of CSS layouts, the DevTools allow you to edit the box model directly.
If you inspect an element on the page, in the right panel click the “Computed” panel next to the “Styles” panel. This shows you a visual interpretation of the box model for that element, with the values as part of the graphic:
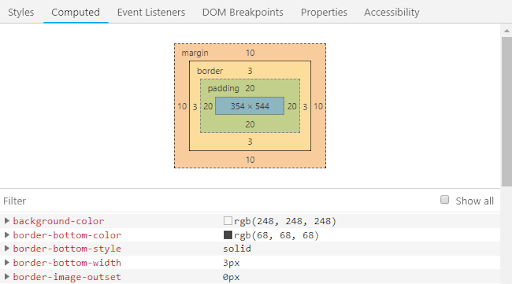
But maybe you didn’t know that you can edit any of those values in place by double clicking them:
Any changes made are reflected on the page in the same way as when you edit the CSS in the Styles panel.
Increment/decrement values in the Styles panel
You are probably already aware that you can edit your CSS in the Styles panel. Just click on a property or value and type in your changes.
But maybe you didn’t realise that numerical values can be incremented or decremented in different ways.
- Up/Down arrow keys increment/decrement by 1
- ALT+Up/Down arrow keys increment/decrement by 0.1
- SHIFT+Up/Down arrow keys increment/decrement by 10
- CTRL+Up/Down arrow keys increment/decrement by 100
You can also use the Page Up or Page Down buttons instead of the arrow keys.
Text editor-like features in Sources panel
You’re probably more familiar with making edits in the Styles panel than anywhere else. The Sources panel, however, is a highly underrated feature of the DevTools because of how closely it mimics working in a regular code editor or IDE.
Here are some of the useful things you can do in the Source panel (which you can view by opening DevTools and clicking the “Sources” tab).
Make multiple selections with the CTRL key
If you need to select multiple areas in a single file, you can do this by holding the CTRL key and selecting what you want, even if it’s not contiguous text.
In the above demo I’m selecting three arbitrary parts of the main.css file in the Sources panel and pasting them back into the document. In addition, you can also type in multiple spots at the same time with multiple carets. Again, use the CTRL key to click in multiple spots to make identical edits to all indicated locations.
Column selection with ALT key
In some cases, you might want to select a column of text, which you can’t normally do by default. Some text editors allow you to use the ALT key to accomplish this, and the same is true in the Sources panel.
Search by CSS selector with CTRL-SHIFT-O
With a file open in the Sources panel, press CTRL-SHIFT-O on your keyboard to open up the “Goto Anything” box, which is a well-known feature in Sublime Text Editor.
After hitting CTRL-SHIFT-O, you can type a CSS selector that you want to find in the file, and the DevTools will give you options to choose to jump to a specific part of the file.
Responsive design features in Chrome and Firefox
You’ve probably seen one of those websites that lets you test the responsiveness of your layout right in the browser with a few clicks. Well, you can do the same thing with Chrome’s Device Mode.
Just open the DevTools and click the “Toggle device toolbar” button in the top-left area of the DevTools (CTRL-SHIFT-M will also do it):

As you can see, the device toolbar has multiple options to change the view according to device size and device type, and you can even make those changes manually by adjusting the width and height numbers or by dragging the handles in the viewport area.
Firefox has a similar feature with the added “@media rules” panel that allows you to click on a breakpoint from the site’s stylesheet. You can see me using this on one of my websites in the demo below.
Colour features in DevTools
Dealing with colour values in CSS is a constant. DevTools makes it so much easier to edit, test, and otherwise fiddle with colour values. Here are some things you can do.
Contrast ratio
First, there are the accessibility features. When you see a colour value in the Styles panel, you can click the swatch next to the colour value to open the colour picker. Inside the colour picker, you’ll see a contrast ratio option that indicates whether your choice of text colour has an accessible contrast in relation to the background.
As you can see in the above demo, the colour picker shows a curved white line in the colour spectrum. This line indicates where the minimum acceptable contrast ratio begins and ends. When I move the colour value above the white line, the contrast ratio value loses its green checkmark, indicating poor contrast.
Colour palettes
In addition to the accessibility features, you also have access to different colour palettes, including a Material Design palette and one associated with the currently viewed page.
Toggling colour value syntax
Finally, one little-known tidbit on viewing colour values in DevTools is the ability to switch the syntax of a specific colour value. By default, the Styles panel will show the syntax for the colour as it was written in the CSS. But the DevTools let you toggle between hex, RGBA, an HSLA by holding the shift key and clicking the swatch next to the colour value:
Editing CSS shadows
Text shadows and box shadows can be tedious to try to write out in your CSS by hand. The syntax is easy to forget and the two kinds of shadows have slightly differing syntax.
Conveniently, the Chrome DevTools allow you to add a text shadow or box shadow using a visual editor.
As shown in the demo, you can add a box shadow or text shadow to any element using the option bar that appears at the bottom right corner of any style rule in the Styles panel. After the shadow is added, you can modify the shadow’s various properties using a visual editor. This editor can then be brought up again for any existing shadow using the “Open shadow editor” option next to the property name.
Grid Layout Inspector in Firefox
Now that Grid Layout is supported in the majority of in-use browsers, more and more developers are using it as their default layout method. Firefox’s developer tools now feature a “Grid” section in the “Layout” tab of the developer tools.
This feature allows you to enable an overlay grid that helps to visualise the different parts of your grid layout. You can also display line numbers, area names, and you can choose to extend the grid lines infinitely if that helps you. In the example demo, I’m using this example site by Jen Simmons, which is responsive, so you can see the benefits of the overlay when the layout changes for different sized viewports.
CSS filters editor in Firefox
Filters are another feature that now have near-universal support in both mobile and desktop browsers. Once again, Firefox offers a handy little tool to help you edit your filter values.
Once you’ve got a filter in place in your code (tip: you can start with filter: none if you don’t know the syntax for an actual filter from memory), you’ll notice a gray and white swatch next to the filter’s value. Click that swatch to open the filter editor.
You can add multiple filters to a single value, delete individual filter values, and you can drag and drop individual filters to rearrange the order in which they’re applied.
Edit CSS animations in Chrome’s Styles panel
Static elements are fairly straightforward to edit in the Styles panel in Chrome’s DevTools. But what about animations created using the animation property and the @keyframes at-rule?
DevTools has two ways you can edit animations. First, when you inspect an element or select it in the Elements panel, all the element’s styles appear in the Styles panel – including the defined @keyframes. In the following demo, I’m selecting an animated element, then adjusting and fiddling with some of the keyframe settings.
But that’s not all. Chrome’s DevTools also features an Animation panel that allows you to edit an animation and its various parts using a visual timeline. You can access this feature by going into the “Customize and control DevTools” option (the three dots), choosing “More tools”, and selecting “Animations”.
As shown above, you can edit each individual animated element’s timeline, then once your edits are complete, you can scrub through the animation to see the changes live on the page. This is a cool feature for designing and debugging complex CSS animations!
View unused CSS in DevTools
Lately there’s been an influx of tools that help you track down parts of your CSS not used on specific pages. This way you can choose to either remove them altogether or load them only when necessary. This will have clear performance advantages.
Chrome allows you to view unused CSS right inside the DevTools by means of the “Coverage” panel. This panel can be opened by clicking the “Customize and control DevTools” (three dots) option, then “More tools”, then “Coverage”.
As shown in the demo, once you’re in the Coverage panel, you can select a source file to open it in the “Sources” panel. When the file opens in Sources, you’ll notice green and red indicator lines next to each style rule in the CSS file. These indicate if that part of the CSS was used on the current page.
Conclusion
Your browser’s developer tools are a treasure trove of CSS editing and debugging features. And when you combine these suggestions with a feature in Chrome like Workspaces (which allows you to save changes made in DevTools to a local file), the process of debugging becomes even more complete.
I hope these tips and suggestions will enhance your CSS editing and debugging abilities in your future projects.